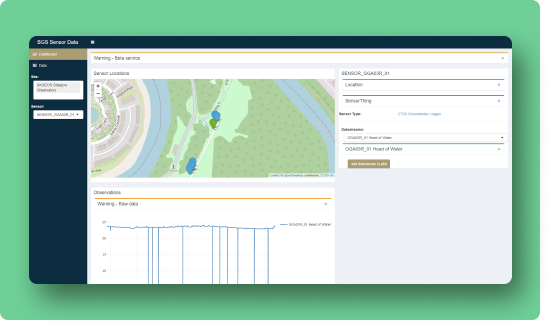
Sensor dashboard
Explore sensors data in our online viewer. Preview data online and download it for further analysis.
API
Access sensor data through our API, build custom apps and integrate it into other tools.
This is a beta service. If you would like to provide feedback or suggestions, please contact enquiries@bgs.ac.uk
Real-time monitoring of environmental phenomena is a large and growing area of interest at BGS and in the wider research community. We provide scalable, robust ways of managing high volume, highly varied data generated by a range of scientific projects, including:
BGS collect data from sensors located throughout the UK and beyond. You can explore and access these data using our sensors dashboard or the application programming interface (API).

Explore sensors data in our online viewer. Preview data online and download it for further analysis.

Access sensor data through our API, build custom apps and integrate it into other tools.
We collect data from sensors located throughout the UK and beyond capturing information on properties such as groundwater temperature and levels, barometric air pressure and motion sensors. We have recently started collecting information related to the energy efficiency of buildings and have developed techniques for incorporating data from sensors operated by other institutions.
Some of the data we collect is available through the sensor API and sensor dashboard which provides easy access to the API data. The API currently serves data from Glasgow and Cardiff and further sensors will be added soon.
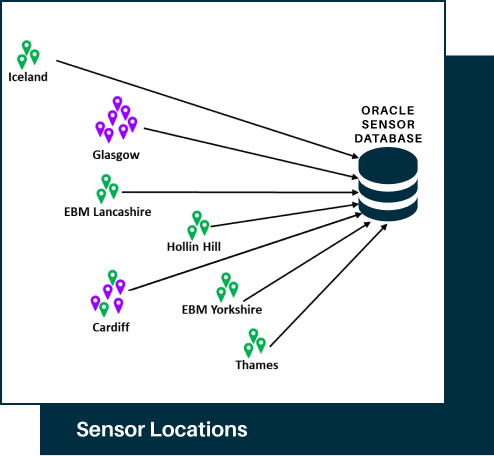
We managed the sensor data in a consistent, scalable manner, regardless of the type of sensor, where it is located or who set it up.
We have developed an architecture for streaming sensor data into a central data store where it can be standardised, cleaned up and generally prepared for the many potential users that want to access it.
A key element of this approach is to hold all of the data and metadata relating to a sensor in our central database. That data and metadata canthen be optimised to meet the requirements of different users.

The data from telemetered sensors is continually gathered via WIFI or SIM cards onto gateway computers. New data is collected from the gateways every 4 hours, 24 hours a day, and loaded into the central database through a data pipeline. Data from other sensors is collected manually from the field, and files are uploaded to the BGS network. This data is also loaded into the database through the data pipeline – checks for new files are made at least once a day.
Once sensor observations are recorded in the central database, those to be released through the BGS sensor API are loaded on a daily basis. From here the data can be accessed through our Sensor Dashboard or directly from the API. The API follows the OGC SensorThings standard.
The Oracle sensor database is the central data store for most sensor data captured by BGS, and the source of all information in the API.
The query layers and data loader process apply filters to the data during its transfer, and information about these filters is held against the data records in the API.
Only publicly available data is released, but there may still be restrictions on how the data can be accessed and used. Properties access restrictions and data usage are held on all records to identify the restrictions.
Data from some sensors is sent directly to the API; other data must be checked and validated prior to its release. The 'resultQuality’ field (populated for all observations) indicates the status of each reading (e.g. provisional, validated) and it’s quality (e.g. good; suspect; rejected). While status is used as a filter for data reaching the API, quality is not. This allows full datasets to be released, but with an indication where data quality is questionable.
The data from some sensors is outside the scope of the Oracle sensor database (and the API), most notably seismic and electrical resistivity tomography (ERT) data, which have their own solutions for capturing and reporting data.
Most sensors make observations of a property (or properties) at a single location over time. The data captured by a sensor for a single property in known as a datastream. Datastreams can be selected,Within the sensor dashboard the and their data plotted over time, and downloaded. Simple sensor types include:
Most properties for which we gather data are directly ‘measured’ by a sensor, but some are ‘calculated’ as part of the data pipeline.
A few types of sensor capture more complex data, two or more properties with dependent values are captured at a single point in time, at multiple locations. The data captured by a sensor for a group of properties is known as a multidatastream, but within the Sensor Dashboard these appear as a single datastream showing all properties. Their data cannot currently be plotted, but can be downloaded.
Currently we only capture complex data from DTS sensors (connected to a PRIME system),which are fibre optic cables that provide linear temperature profiles.
As mentioned before, the data from some sensor types is not held within the Oracle database (ERT, seismic) but the sensors themselves can still be recorded for completeness. There will be no datastreams, but a link to their data will be available from the API and sensor dashboard.
During the lifetime of a sensor, as well as logging data, events are recorded in the central database to provide details about the sensor’s installation, maintenance, data collection, problems that occur, etc.
These events are available in the API, through an ‘Events’ datastream.
Some events impact the quality flags held against sensor data. For example, when a sensor is removed from a borehole temporarily for data collection, spikes are seen in the recorded values during the period that the sensor is out of position. These spikes make data plots in the Sensor Dashboard difficult to read. Recording the data collection periods as events will reject any data recorded during this time. Using the ‘hide data flagged as rejected’ switch on the Sensor Dashboard excludes these rejected values and makes the plot much clearer.
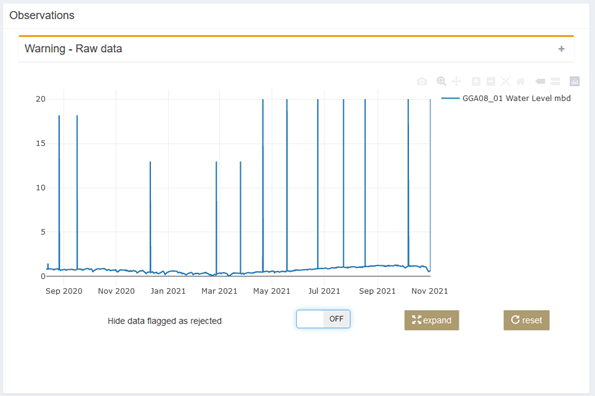
All data
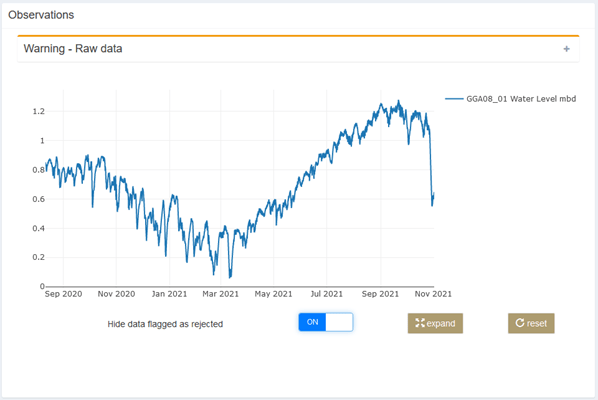
The same data with ‘rejected’ observations excluded
If you have any questions or would like to provide feedback or suggestions, please contact enquiries@bgs.ac.uk